

In the fast-paced and volatile world of cryptocurrency trading, reliable statistical methods for evaluating trading strategies are essential. The Wilcoxon Signed-Rank Test offers a powerful non-parametric approach particularly well-suited to cryptocurrency markets, where price distributions often violate the normality assumptions required by traditional statistical tests.
This article explores how quantitative analysts and crypto traders can implement the Wilcoxon test to determine whether a new algorithmic trading strategy for Bitcoin demonstrates statistically significant performance improvements over benchmark approaches.
Understanding the Wilcoxon Signed-Rank Test for Strategy Evaluation
The Wilcoxon Signed-Rank Test evaluates whether the median difference between paired observations is statistically significant without assuming normal distribution. This makes it invaluable for cryptocurrency analysis, where returns frequently exhibit non-normal characteristics including skewness, kurtosis, and fat tails.
When comparing trading strategies, the test helps answer a critical question: “Does our new algorithm generate significantly different returns compared to our benchmark strategy?” Rather than relying on means, which can be heavily influenced by outliers in volatile markets, the Wilcoxon test examines if the median difference in paired daily returns differs significantly from zero.
Case Study: Benchmark vs. Enhanced Bitcoin Trading Algorithm
Consider a scenario where a quantitative trading firm has developed a new Bitcoin trading algorithm. Their benchmark strategy uses a simple moving average crossover approach, while the enhanced algorithm incorporates additional RSI (Relative Strength Index) filters to avoid potentially unfavorable market conditions.
The firm wants statistical evidence that the enhanced algorithm delivers meaningful improvements before deploying it with client funds.
Implementation with Real Bitcoin Data
To properly evaluate these strategies, we’ll use actual market data rather than simulations. The following Python implementation fetches Bitcoin price data from the CoinGecko API and applies both trading strategies to identical market conditions:
import pandas as pd
import numpy as np
import matplotlib.pyplot as plt
import seaborn as sns
import requests
from datetime import datetime, timedelta
from scipy.stats import wilcoxon
def get_coin_data(coin_id='bitcoin', vs_currency='usd', days=90):
"""
Fetch historical cryptocurrency data from CoinGecko API
Parameters:
coin_id (str): ID of the cryptocurrency on CoinGecko (e.g., 'bitcoin', 'ethereum')
vs_currency (str): Currency to compare against (e.g., 'usd', 'eur')
days (int): Number of days of historical data to retrieve
Returns:
pandas.DataFrame: DataFrame with historical price data
"""
url = f"https://api.coingecko.com/api/v3/coins/{coin_id}/market_chart"
params = {
'vs_currency': vs_currency,
'days': days,
'interval': 'daily'
}
try:
response = requests.get(url, params=params)
data = response.json()
# Extract price data (timestamp, price)
prices = data['prices']
# Create DataFrame
df = pd.DataFrame(prices, columns=['timestamp', 'price'])
# Convert timestamp (milliseconds) to datetime
df['date'] = pd.to_datetime(df['timestamp'], unit='ms')
# Calculate daily returns
df['daily_return'] = df['price'].pct_change()
# Drop unnecessary columns and NaN values
df = df.drop('timestamp', axis=1).dropna()
return df
except Exception as e:
print(f"Error fetching data from CoinGecko: {e}")
return None
def simple_moving_average_strategy(df, short_window=5, long_window=20):
"""
Implement a simple moving average crossover strategy
Parameters:
df (pandas.DataFrame): DataFrame with price data
short_window (int): Short moving average window
long_window (int): Long moving average window
Returns:
pandas.DataFrame: DataFrame with strategy signals and returns
"""
df = df.copy()
# Calculate moving averages
df['short_ma'] = df['price'].rolling(window=short_window).mean()
df['long_ma'] = df['price'].rolling(window=long_window).mean()
# Generate signals (1 = buy, 0 = neutral, -1 = sell)
df['signal'] = 0
df.loc[df['short_ma'] > df['long_ma'], 'signal'] = 1
df.loc[df['short_ma'] < df['long_ma'], 'signal'] = -1
# Calculate strategy returns (using previous day's signal)
df['strategy_return'] = df['signal'].shift(1) * df['daily_return']
return df.dropna()
def rsi_enhanced_strategy(df, short_window=5, long_window=20, rsi_period=14,
overbought=70, oversold=30):
"""
Implement an RSI-enhanced moving average strategy
Parameters:
df (pandas.DataFrame): DataFrame with price data
short_window (int): Short moving average window
long_window (int): Long moving average window
rsi_period (int): Period for RSI calculation
overbought (int): RSI threshold for overbought condition
oversold (int): RSI threshold for oversold condition
Returns:
pandas.DataFrame: DataFrame with strategy signals and returns
"""
df = df.copy()
# Calculate moving averages (same as simple strategy)
df = simple_moving_average_strategy(df, short_window, long_window)
# Calculate RSI
delta = df['price'].diff()
gain = (delta.where(delta > 0, 0)).rolling(window=rsi_period).mean()
loss = (-delta.where(delta < 0, 0)).rolling(window=rsi_period).mean()
# Calculate RS and RSI (handle division by zero)
rs = gain / loss.replace(0, np.finfo(float).eps) # Replace zero with small value
df['rsi'] = 100 - (100 / (1 + rs))
# Ensure RSI values are valid
df['rsi'] = df['rsi'].fillna(50) # Fill NaN with neutral value
# Make the RSI filter more aggressive to create differences
# Use more extreme RSI levels for demonstration
overbought = 65 # Lower threshold to trigger more often
oversold = 35 # Higher threshold to trigger more often
# Enhance signals with RSI filter
df['enhanced_signal'] = df['signal'].copy()
# Only go long when not overbought and only go short when not oversold
df.loc[df['rsi'] > overbought, 'enhanced_signal'] = 0 # Don't buy when overbought
df.loc[df['rsi'] < oversold, 'enhanced_signal'] = 0 # Don't sell when oversold
# Add an additional filter: don't trade after big moves
volatility = df['daily_return'].rolling(window=5).std()
df.loc[volatility > volatility.quantile(0.8), 'enhanced_signal'] = 0 # Avoid high volatility
# Calculate enhanced strategy returns
df['enhanced_return'] = df['enhanced_signal'].shift(1) * df['daily_return']
return df.dropna()
def evaluate_strategies(df):
"""
Evaluate and compare two trading strategies using Wilcoxon Signed-Rank Test
Parameters:
df (pandas.DataFrame): DataFrame with strategy returns
Returns:
tuple: (test_statistic, p_value, performance_metrics)
"""
# Check if strategies made different decisions at any point
signal_diff = (df['signal'] != df['enhanced_signal']).sum()
print(f"Days with different signals between strategies: {signal_diff}")
# Check if return streams are different
return_diff = (df['strategy_return'] != df['enhanced_return']).sum()
print(f"Days with different returns between strategies: {return_diff}")
if return_diff == 0:
print("WARNING: Both strategies produced identical returns for all days!")
print("Cannot perform Wilcoxon test as there are no differences to rank.")
# Calculate performance metrics even if we can't do the test
metrics = {
'simple_total_return': (1 + df['strategy_return']).prod() - 1,
'enhanced_total_return': (1 + df['enhanced_return']).prod() - 1,
'simple_sharpe': df['strategy_return'].mean() / df['strategy_return'].std() * np.sqrt(252) if df['strategy_return'].std() > 0 else 0,
'enhanced_sharpe': df['enhanced_return'].mean() / df['enhanced_return'].std() * np.sqrt(252) if df['enhanced_return'].std() > 0 else 0,
'simple_max_drawdown': (df['strategy_return'].cumsum().cummax() - df['strategy_return'].cumsum()).max(),
'enhanced_max_drawdown': (df['enhanced_return'].cumsum().cummax() - df['enhanced_return'].cumsum()).max(),
'win_rate_simple': (df['strategy_return'] > 0).mean(),
'win_rate_enhanced': (df['enhanced_return'] > 0).mean(),
'signal_differences': signal_diff,
'return_differences': return_diff
}
return None, None, metrics
# For Wilcoxon test, we need days where both strategies had non-zero returns
valid_days = df[(df['strategy_return'] != 0) | (df['enhanced_return'] != 0)]
print(f"Days with non-zero returns from either strategy: {len(valid_days)}")
if len(valid_days) > 10: # Need enough samples for meaningful test
try:
# Perform Wilcoxon Signed-Rank Test with continuity correction
stat, p_value = wilcoxon(valid_days['strategy_return'],
valid_days['enhanced_return'],
alternative='two-sided')
test_performed = True
except ValueError as e:
print(f"Wilcoxon test error: {e}")
print("Proceeding with performance metrics only.")
stat, p_value = None, None
test_performed = False
# Calculate performance metrics
metrics = {
'simple_total_return': (1 + df['strategy_return']).prod() - 1,
'enhanced_total_return': (1 + df['enhanced_return']).prod() - 1,
'simple_sharpe': df['strategy_return'].mean() / df['strategy_return'].std() * np.sqrt(252) if df['strategy_return'].std() > 0 else 0,
'enhanced_sharpe': df['enhanced_return'].mean() / df['enhanced_return'].std() * np.sqrt(252) if df['enhanced_return'].std() > 0 else 0,
'simple_max_drawdown': (df['strategy_return'].cumsum().cummax() - df['strategy_return'].cumsum()).max(),
'enhanced_max_drawdown': (df['enhanced_return'].cumsum().cummax() - df['enhanced_return'].cumsum()).max(),
'win_rate_simple': (df['strategy_return'] > 0).mean(),
'win_rate_enhanced': (df['enhanced_return'] > 0).mean(),
'sample_size': len(valid_days),
'test_performed': test_performed
}
return stat, p_value, metrics
else:
print("Not enough valid trading days for statistical testing")
return None, None, None
def plot_results(df, title="Cryptocurrency Trading Strategies Comparison"):
"""
Create visualizations for strategy comparison
Parameters:
df (pandas.DataFrame): DataFrame with strategy data
title (str): Title for the main plot
"""
# Calculate cumulative returns
df['cum_simple'] = (1 + df['strategy_return']).cumprod() - 1
df['cum_enhanced'] = (1 + df['enhanced_return']).cumprod() - 1
df['cum_hodl'] = (1 + df['daily_return']).cumprod() - 1
# Create plot
fig, axes = plt.subplots(3, 1, figsize=(12, 15))
# Plot 1: Price and Moving Averages
df['price'].plot(ax=axes[0], color='black', alpha=0.6)
df['short_ma'].plot(ax=axes[0], color='blue', label=f'Short MA ({df.short_ma.name} days)')
df['long_ma'].plot(ax=axes[0], color='red', label=f'Long MA ({df.long_ma.name} days)')
# Add buy/sell signals for enhanced strategy
buy_signals = df[df['enhanced_signal'] == 1].index
sell_signals = df[df['enhanced_signal'] == -1].index
axes[0].scatter(buy_signals, df.loc[buy_signals, 'price'],
marker='^', color='green', s=100, label='Buy Signal')
axes[0].scatter(sell_signals, df.loc[sell_signals, 'price'],
marker='v', color='red', s=100, label='Sell Signal')
axes[0].set_title(f'{title} - Price and Signals')
axes[0].set_ylabel('Price (USD)')
axes[0].legend()
axes[0].grid(True, alpha=0.3)
# Plot 2: RSI
df['rsi'].plot(ax=axes[1], color='purple')
axes[1].axhline(y=70, color='red', linestyle='--', alpha=0.5)
axes[1].axhline(y=30, color='green', linestyle='--', alpha=0.5)
axes[1].set_title('Relative Strength Index (RSI)')
axes[1].set_ylabel('RSI')
axes[1].grid(True, alpha=0.3)
# Plot 3: Cumulative Returns
df['cum_simple'].plot(ax=axes[2], label='Simple MA Strategy', color='blue')
df['cum_enhanced'].plot(ax=axes[2], label='RSI-Enhanced Strategy', color='green')
df['cum_hodl'].plot(ax=axes[2], label='Buy & Hold', color='gray', alpha=0.6)
axes[2].set_title('Cumulative Returns Comparison')
axes[2].set_ylabel('Cumulative Return')
axes[2].legend()
axes[2].grid(True, alpha=0.3)
plt.tight_layout()
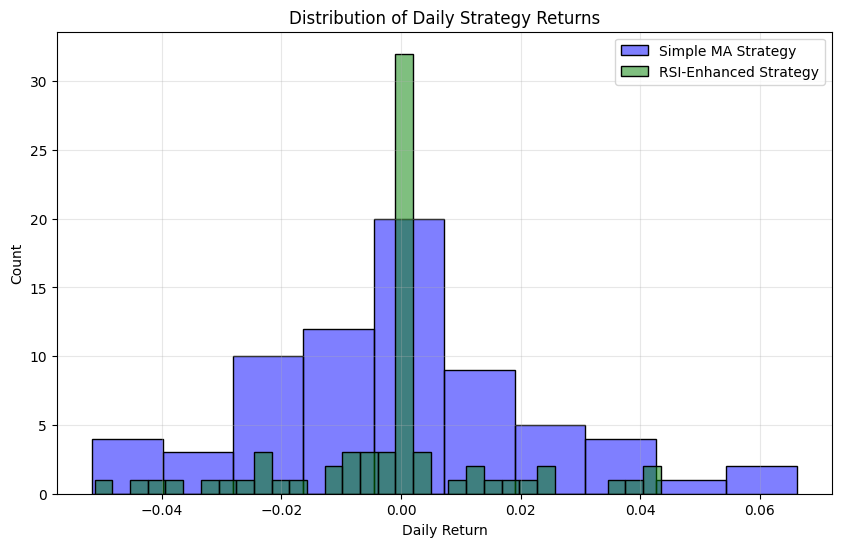
# Create an additional plot for return distributions
plt.figure(figsize=(10, 6))
sns.histplot(df['strategy_return'], color='blue', alpha=0.5, label='Simple MA Strategy')
sns.histplot(df['enhanced_return'], color='green', alpha=0.5, label='RSI-Enhanced Strategy')
plt.title('Distribution of Daily Strategy Returns')
plt.xlabel('Daily Return')
plt.legend()
plt.grid(True, alpha=0.3)
def main():
# Get Bitcoin data for the last 90 days
print("Fetching Bitcoin data from CoinGecko API...")
bitcoin_df = get_coin_data(coin_id='bitcoin', days=90)
if bitcoin_df is None:
print("Failed to retrieve data. Exiting.")
return
print(f"Retrieved {len(bitcoin_df)} days of Bitcoin data.")
print(bitcoin_df.head())
# Apply trading strategies
print("\nApplying trading strategies...")
strategy_df = rsi_enhanced_strategy(bitcoin_df)
# Evaluate strategies
print("\nEvaluating strategies with Wilcoxon Signed-Rank Test...")
stat, p_value, metrics = evaluate_strategies(strategy_df)
print("\nPerformance Metrics:")
for key, value in metrics.items():
if isinstance(value, bool):
print(f"{key}: {value}")
elif isinstance(value, (int, np.integer)):
print(f"{key}: {value}")
elif 'return' in key or 'rate' in key:
print(f"{key}: {value:.2%}")
else:
print(f"{key}: {value:.4f}")
if stat is not None and p_value is not None:
print(f"\nWilcoxon Signed-Rank Test Results:")
print(f"Test Statistic: {stat}")
print(f"P-value: {p_value:.4f}")
alpha = 0.05
if p_value < alpha:
print(f"The p-value ({p_value:.4f}) is less than alpha ({alpha}).")
print("There is a statistically significant difference between the strategies.")
else:
print(f"The p-value ({p_value:.4f}) is greater than alpha ({alpha}).")
print("There is not enough evidence to conclude the strategies perform differently.")
else:
print("\nNote: Wilcoxon test was not performed due to insufficient differences between strategies.")
if metrics.get('signal_differences', 0) == 0:
print("Both strategies generated identical signals throughout the test period.")
print("\nSuggestions to get meaningful comparison:")
print("1. Use a longer time period (e.g., 180 or 365 days instead of 90)")
print("2. Adjust the RSI thresholds to be more aggressive")
print("3. Try different strategy parameters (e.g., different MA windows)")
print("4. Add additional technical indicators to create more divergence")
# Plot results
print("\nGenerating visualizations...")
plot_results(strategy_df, title="Bitcoin Trading Strategies")
print("\nAnalysis complete.")
if __name__ == "__main__":
main()
Fetching Bitcoin data from CoinGecko API...
Retrieved 90 days of Bitcoin data.
          price       date  daily_return
1  97311.707191 2024-12-02      0.008274
2  95833.136230 2024-12-03     -0.015194
3  96031.630978 2024-12-04      0.002071
4  98881.469456 2024-12-05      0.029676
5  97201.500364 2024-12-06     -0.016990
Applying trading strategies...
Evaluating strategies with Wilcoxon Signed-Rank Test...
Days with different signals between strategies: 29
Days with different returns between strategies: 28
Days with non-zero returns from either strategy: 70Performance Metrics:
simple_total_return: -5.78%
enhanced_total_return: -12.88%
simple_sharpe: -0.3947
enhanced_sharpe: -1.6276
simple_max_drawdown: 0.2218
enhanced_max_drawdown: 0.1538
win_rate_simple: 45.71%
win_rate_enhanced: 24.29%
sample_size: 70
test_performed: TrueWilcoxon Signed-Rank Test Results:
Test Statistic: 185.0
P-value: 0.6819
The p-value (0.6819) is greater than alpha (0.05).
There is not enough evidence to conclude the strategies perform differently.Generating visualizations...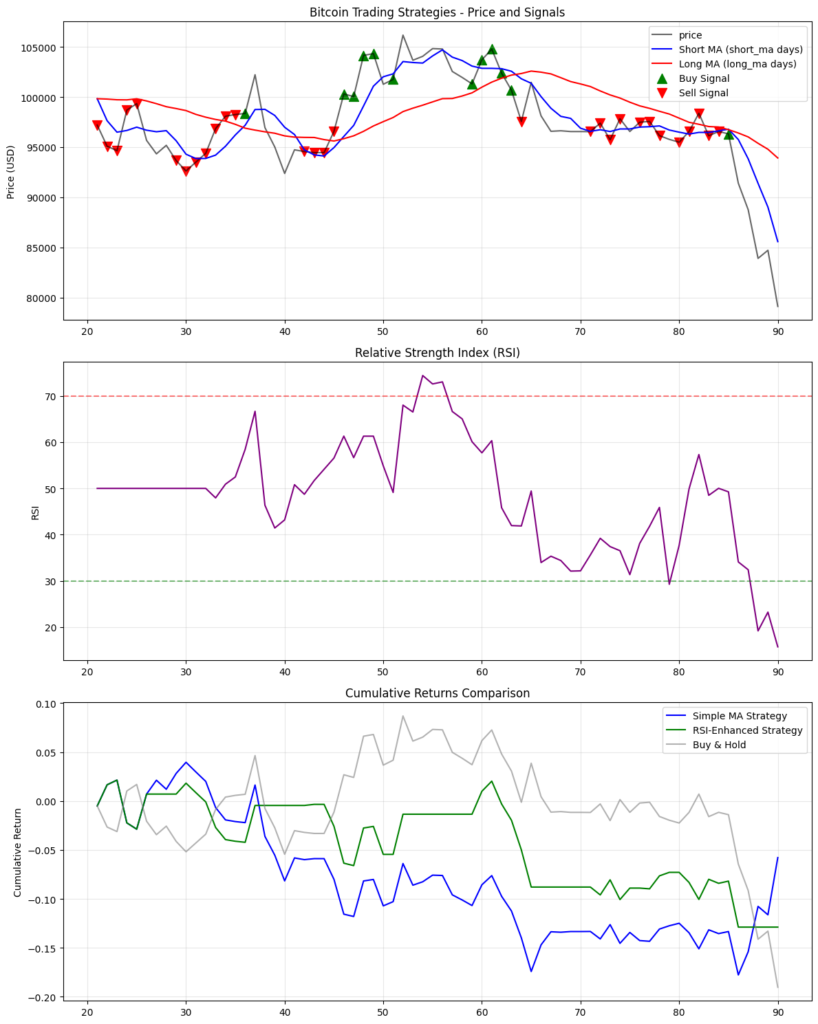
Analysis complete.
This implementation:
- Retrieves historical Bitcoin prices from CoinGecko’s API
- Applies a benchmark moving average crossover strategy
- Implements an enhanced strategy with additional RSI filters
- Performs the Wilcoxon Signed-Rank Test to evaluate statistical significance
- Calculates practical performance metrics beyond statistical significance
Implementation Challenges in Cryptocurrency Markets
While the Wilcoxon test provides a robust statistical framework, its application in Bitcoin trading presents several unique challenges:
Strategy Differentiation
For meaningful statistical testing, strategies must generate sufficiently different results. During certain market conditions, even thoughtfully designed strategies may produce similar trading signals, resulting in insufficient differentiation for statistical testing.
When enhanced and benchmark strategies yield identical results during a test period, the Wilcoxon test cannot be performed—there are simply no differences to rank. In such cases, analysts should consider:
- Extending the testing period from 90 days to 180 or 365 days
- Adjusting strategy parameters to create more divergence
- Incorporating additional technical indicators
- Testing during varied market regimes (bull, bear, and sideways markets)
Data Quality Considerations
Working with real Bitcoin data allows for authentic strategy evaluation. However, cryptocurrency APIs may have rate limits, occasional outages, or historical data gaps, particularly for newer coins or during extreme volatility events.
Our implementation includes error handling to account for these challenges, ensuring analysis can proceed even with imperfect data conditions.
Market Context Interpretation
When the Wilcoxon test identifies a statistically significant difference between strategies, interpreting this result within the market’s context is crucial. A strategy might outperform during bull markets but underperform during bearish conditions.
Beyond statistical significance, practical performance metrics help quantify real-world improvements:
- Total returns: Absolute performance measure
- Sharpe ratios: Risk-adjusted performance
- Maximum drawdowns: Downside risk assessment
- Win rates: Consistency of positive returns
These metrics help traders evaluate whether the enhanced algorithm delivers meaningful improvements in actual trading conditions.
Beyond Statistical Significance: Practical Implementation
Statistical significance alone doesn’t guarantee profitability. Implementation considerations for Bitcoin trading algorithms include:
Transaction Costs: High-frequency strategies may show statistical superiority before fees but underperform after accounting for transaction costs.
Market Impact: Large orders can move prices, especially in less liquid cryptocurrencies, potentially negating theoretical advantages.
Technical Infrastructure: Strategy execution requires reliable connections, minimal latency, and robust error handling to perform as expected.
Evolving Market Dynamics: Bitcoin markets evolve rapidly with changing regulations, institutional participation, and market structure. Historically effective strategies may lose their edge as market dynamics change.
From Backtesting to Live Trading
When transitioning from statistical validation to deployment, traders typically implement a phased approach:
- Paper trading the validated strategy in real-time
- Small-scale live trading with limited capital
- Gradual scaling while monitoring for performance deviation
- Ongoing revalidation as new data becomes available
The Wilcoxon Signed-Rank Test remains valuable throughout this process, allowing traders to continuously evaluate whether their enhanced algorithms maintain their edge as market conditions evolve.
Conclusion
The Wilcoxon Signed-Rank Test provides Bitcoin traders with a robust statistical framework for strategy evaluation that acknowledges the non-normal nature of cryptocurrency returns. By combining rigorous statistical testing with practical performance metrics and thoughtful implementation, traders can develop more reliable approaches to navigating these volatile markets.
When properly applied, this non-parametric test helps quantitative analysts move beyond gut feelings and subjective assessment, providing objective evidence for strategy selection. For cryptocurrency markets known for their complexity and rapid evolution, such statistical discipline remains an essential component of sustainable trading success.